Is it a good time to buy a house in Tampa FL?
Of course there is not a simple black and white answer, that would be too easy. Withe the covid-19 virus still rearing its ugly head the expectation would be for home prices to begin to drop. However that has not been the case so far.
Listing inventory is down compared to this time last year and has caused a pike in home prices with competing offers. Interest rates are still at an all time low with no real signs of increasing.
Buying sooner than later could be the wise decision!

Market Report Tampa, Florida
Tampa, Florida
Market Snapshot: Estimated Home Values


|
|
|
|
|
|
|
|
|
Change Over Last Month
|
|
Change Over Last Quarter
|
|
Change Over Last 12 Months
|
|
Change Over Last 24 Months
|
 .48%
.48%
Thismap layer shows the average estimated home values, based on the AVMsand RVMs® for properties in an area. Source(s): Public recordsand MLS data where licensed; updated Quarterly.
Median Est. Home Value
$258K
Updated: 6/30/2020

About this Data: Estimated home values are generated by a valuation model and are not formal appraisals. Valuations are based on public records and MLS data where licensed. The metrics shown here reflect All Residential Properties data.
Tampa, Florida
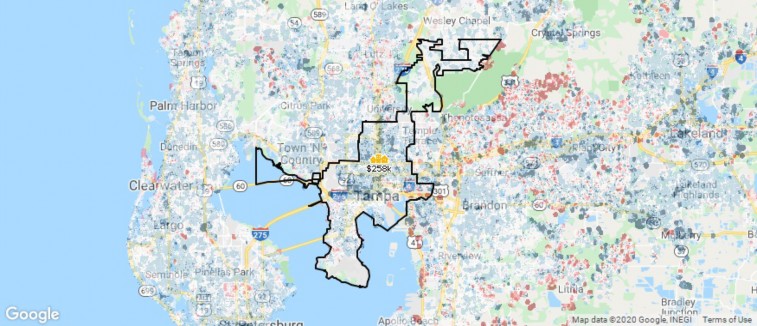
Market Snapshot: 12-Month Change in Estimated Value

|
|
|
|
|
|
|
|
|
|
|
Change Over Last 12 Months
|
|
Change Over Last 24 Months
|
|
Change Over Last 36 Months
|
Thismap layer shows the change in estimated home valuesover the past 12 months, based on the AVMs and RVMs® for properties in an area. Source(s): Public recordsand MLS data where licensed; updated Quarterly.
Median Est. Home Value
$258K
Updated: 6/30/2020
About this Data: Estimated home values are generated by a valuation model and are not formal appraisals. Valuations are based on public records and MLS data where licensed. The metrics shown here reflect All Residential Properties data.
Tampa, Florida
Market Snapshot: Concentration of Distressed Properties
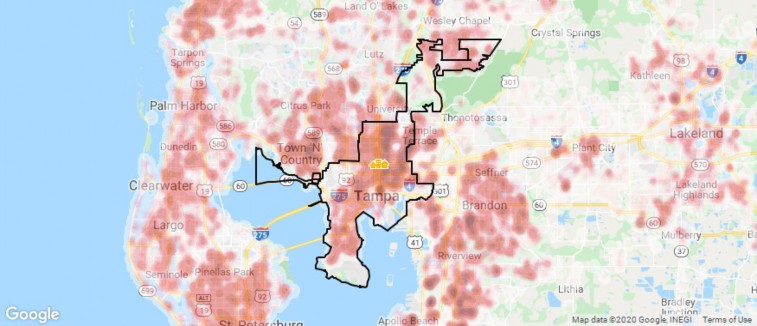

Thismap layer shows the concentration of distres ed properties, in areas where RPR has MLS data. Source(s): MLS data; updated Quarterly.
|
Total # of |
|
# of |
|
# of |
|
# of |
|
Distressed Properties 504 Updated: 7/29/2020 |
|
Pre-Foreclosures 369 |
|
Foreclosures 135 |
|
Short Sales 0 |
About this data: The metrics displayed here reflect distressed property counts (listings and public records) for All Residential Properties as of 7/29/2020.
Market Snapshot: Sales Price
Tampa, Florida

|
|
|
|
|
|
|
|
|
Change Over Last Month
|
|
Change Over Last Quarter
|
|
Change Over Last 12 Months
|
|
Change Over Last 24 Months
|
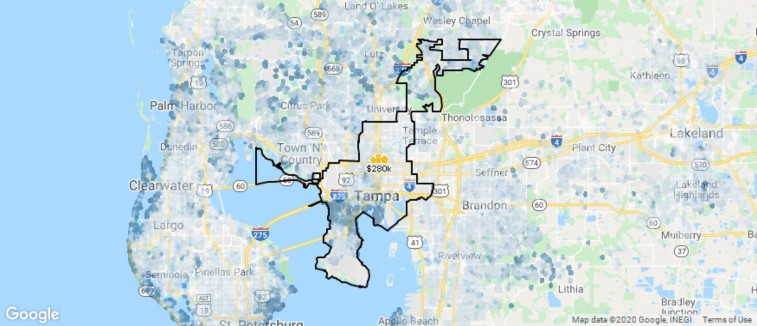
Thismap layer shows the average sales price for properties sold in the previous six months, in areas where RPR has MLS data. Source(s): MLS data; updated Quarterly.
Median Sales Price
$280K
Updated: 6/30/2020
About this data: The Metrics displayed here reflect median sales price for All Residential Properties using MLS listing data.
Market Snapshot: List Price
Tampa, Florida

|
|
|
|
|
|
|
|
|
Change Over Last Month
|
|
Change Over Last Quarter
|
|
Change Over Last 12 Months
|
|
Change Over Last 24 Months
|
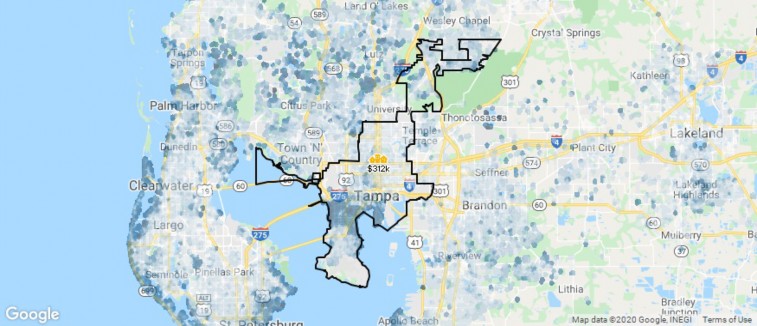
Thismap layer shows the average listing price for properties in the previous six months, in areas where RPR has MLS data. Source(s): MLS data; updated Quarterly.
Median List Price
$313K
Updated: 6/30/2020
About RPR (Realtors Property Resource)
Realtors Property Resource® is a whollyowned subsidiaryof the National Association REALTORS®.
RPR offers comprehensive data – including a nationwide database of 164 million properties – as well as powerful analytics and dynamic reports exclusively for members of the NAR.
RPR's focus is giving residential and commercial real estate practitioners, brokers, and MLS and Association staff the tools theyneed to serve their clients.
This report has been provided to you bya member of the NAR.
About RPR's Data
RPR generates and compiles real estate and other data from a vast arrayof sources. The data contained in your report includes some or all of the following:
Listing data from our partner MLSs and CIEs, and related calculations, like estimated value for a propertyor median sales price for a local market.
Public records data including tax, assessment, and deed information. Foreclosure and distressed data from public records.
Market conditions and forecasts based on listing and public records data.
Census and employment data from the U.S. Census and the U.S. Bureau of Labor Statistics.
Demographics and trends data from Esri. The data in commercial and economic reports includes Tapestry Segmentation, which classifies U.S. residential neighborhoods into unique market segments based on socioeconomic and demographic characteristics.
Business data including consumer expenditures, commercial market potential, retail marketplace, SIC and NAICS business information, and banking potential data from Esri.
School data and reviews from Niche.
Specialty data sets such as walkability scores, traffic counts and flood zones.
Update Frequency
Listings and public records data are updated on a continuous basis.
Charts and statistics calculated from listing and public records data are refreshed monthly.
Other data sets range from daily to annual updates.
Learn more
For more information about RPR, please visit RPR's public website: http://blog.narrpr.com